网络爬虫是一种自动化技术,利用不同的工具或程序从网站提取并收集大量数据。它通常被用来提取包含在 HTML 表格中的数据,这些表格通常以列和行的形式组织数据。一旦数据被收集后,就可以对其进行分析或用于研究。想要了解更多详情,可以查看这篇关于 HTML 网络抓取的文章。
本教程将教你如何使用 Python 来抓取网站上的 HTML 表格。
先决条件
在开始本教程之前,你需要先 安装 Python 3.8 或更新版本,并且 创建一个虚拟环境。如果你是第一次用 Python 进行网络爬虫,可以先阅读这篇文章 Python 网络爬虫来入门。
在创建好虚拟环境之后,安装以下 Python 包:
- Requests 用来发送 HTTP 请求,与网络服务或 API 交互,并从网络服务器中检索或发送数据。
- Beautiful Soup 解析 HTML 文档并从网页中提取特定信息。它提供了一系列工具来以结构化的方式导航、搜索和抓取网页数据。
- pandas 用来分析、清洗、组织数据,并将从 HTML 表格或其它 HTML 元素中抓取的数据保存为 CSV 或 XLSX 等文件格式。
可以使用以下命令安装依赖包:
pip install requests beautifulsoup4 pandas了解网页结构
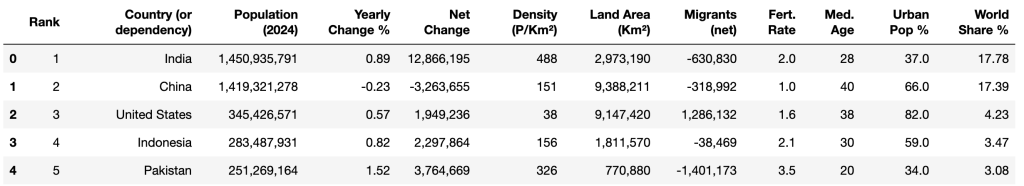
本教程中,你将从 Worldometer 网站上抓取数据。该网页包含世界各国(包含 2024 年)的最新人口数据:
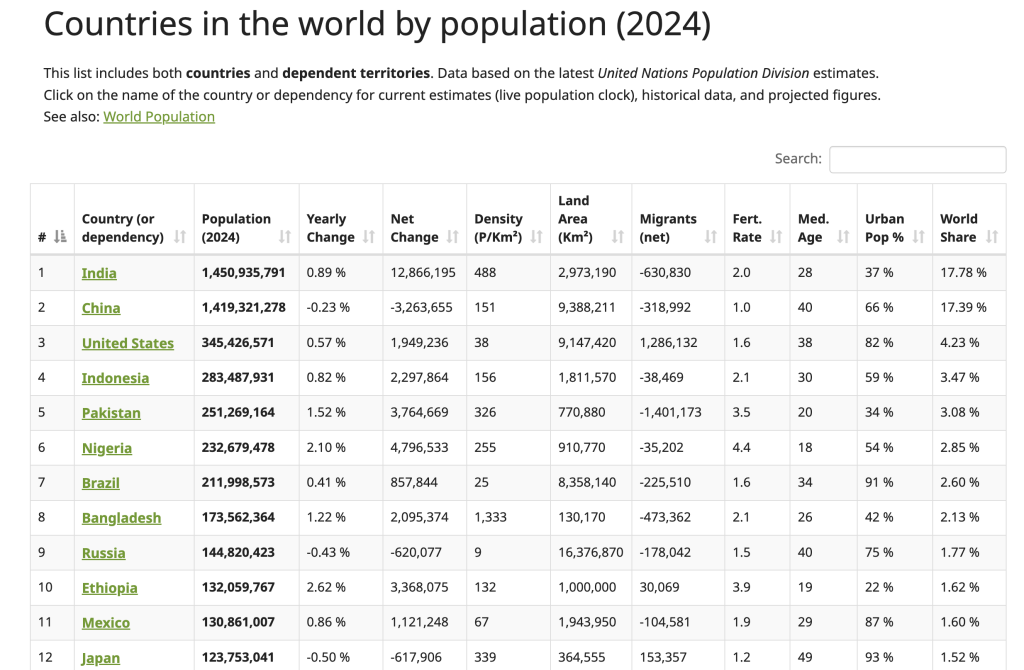
要定位该 HTML 表格的结构,可以右键点击该表格(如上图所示)并选择“检查”。这会打开开发者工具(Developer Tools)面板,并显示页面的 HTML 代码,且会高亮显示你所选的元素:
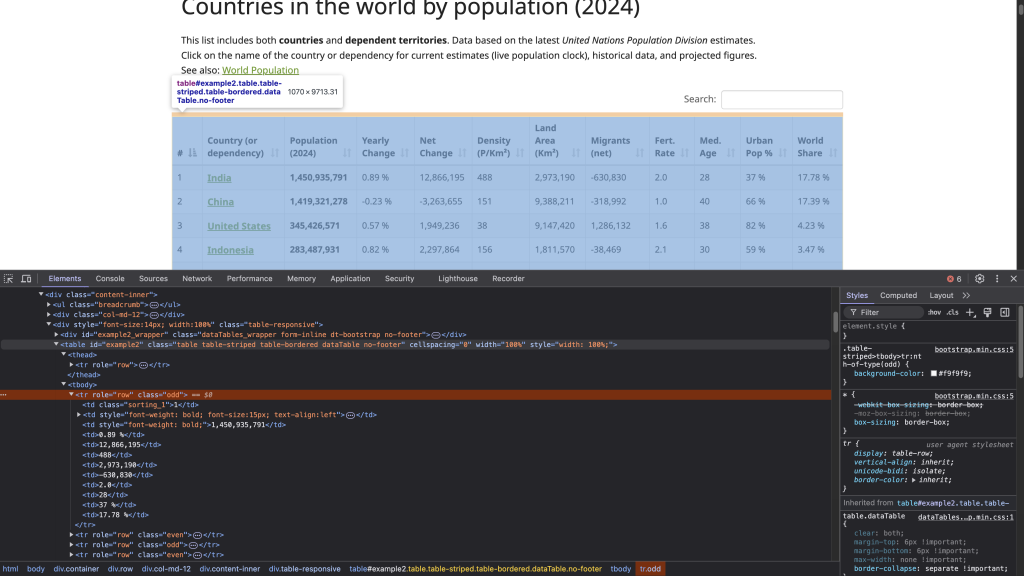
带有 id 属性 example2 的 <table> 标签标志着表格结构的开始。该表格包含以 <th> 为标签的表头,每一行用 <tr> 标签表示,对应表中每一行。而在每个 <tr> 里,<td> 标签创建了该行中的单元格,存放显示在表格中的数据。
注意: 在进行任何爬虫操作之前,你需要首先查看并遵守网站的隐私政策和服务条款,以确保你遵循了所有关于数据使用和自动化访问的限制规定。
发送 HTTP 请求访问网页
要发送 HTTP 请求并访问网页,可以创建一个 Python 文件(例如 html_table_scraper.py),并导入 requests、BeautifulSoup 和 pandas 包:
# import packages
import requests
from bs4 import BeautifulSoup
import pandas as pd
然后,定义目标网页的 URL(这里使用 https://www.worldometers.info/world-population/population-by-country/),并通过 Requests 的 get() 方法发送一个 GET 请求:
# 向网站发送请求以获取页面内容
url = 'https://www.worldometers.info/world-population/population-by-country/'
使用 get() 方法发送请求,并检查响应是否成功:
# Get the content of the URL
response = requests.get(url)

# Check the status of the response.
if response.status_code == 200:
    print("Request was successful!")
else:
    print(f"Error: {response.status_code} - {response.text}")
上述代码向指定 URL 发送 GET 请求,然后检查请求的状态。若返回 200,表示请求成功。
在终端运行该 Python 脚本:
python html_table_scraper.py输出结果应如下所示:
Request was successful!既然 GET 请求成功,那么你已经拿到了整个网页的 HTML 内容,包括其中的 HTML 表格。
使用 Beautiful Soup 解析 HTML
在实际抓取网页时,经常会遇到格式不规范或破损的 HTML 内容。Beautiful Soup 能够处理这些情况。这里,你将使用 Beautiful Soup 来完成以下工作:
- 解析网页内容,找到包含人口数据的表格。
- 收集表格头部数据。
- 收集表格行中的所有数据。
首先,创建一个 Beautiful Soup 对象来解析获取到的网页内容:
# Parse the HTML content using BeautifulSoup
soup = BeautifulSoup(response.content, 'html.parser')
接下来,通过查找具有 id 属性值为 "example2" 的表格获取 2024 年的各国人口数据:
# Find the table containing population data
table = soup.find('table', attrs={'id': 'example2'})
收集表头
该表格具有位于 <thead> 和 <th> 标签中的表头。可以使用 Beautiful Soup 的 find() 方法来获取 <thead>,再用 find_all() 方法收集所有表头:
# Collect the headers from the table
headers = []

# Locate the header row within the <thead> tag
header_row = table.find('thead').find_all('th')

for th in header_row:
    # Add header text to the headers list
    headers.append(th.text.strip())
上面的代码创建了一个名为 headers 的空列表,通过定位 <thead> 下的所有 <th> 标签来获取全部表头,并将每个表头的文本添加到 headers 列表中。
收集所有行数据
要收集每行的数据,可以先创建一个空列表 data 来存储获取到的数据:
# 初始化一个空列表来存储表格数据
data = []
然后,使用 find_all() 方法提取表格中的每一行并将数据添加到 data 列表:
# Loop through each row in the table (skipping the header row)
for tr in table.find_all('tr')[1:]:
    # Create a list of the current row's data
    row = []

# Find all data cells in the current row
    for td in tr.find_all('td'):
        # Get the text content of the cell and remove extra spaces
        cell_data = td.text.strip()

        # Add the cleaned cell data to the row list
        row.append(cell_data)

    # After getting all cells for this row, add the row to our data list
    data.append(row)

# Convert the collected data into a pandas DataFrame for easier handling
df = pd.DataFrame(data, columns=headers)

# Print the DataFrame to see the number of rows and columns
print(df.shape)
上述代码会遍历表格中所有的 <tr> 标签,从第二行开始(跳过表头)。对于每个 <tr>,先创建一个空的 row 列表用来盛放该行中的数据单元格。随后,找出该行中所有的 <td> 标签,并通过 .text 提取文本,.strip() 去除前后空格。最后将清洗后的数据插入当前行列表 row,并把整行数据附加到 data 列表里。最终,你将使用 pd.DataFrame() 将采集的数据转为 pandas DataFrame,并打印其形状。
完整的 Python 脚本如下:
# Import packages
import requests
from bs4 import BeautifulSoup
import pandas as pd

# Send a request to the website to get the page content
url = 'https://www.worldometers.info/world-population/population-by-country/'

# Get the content of the URL
response = requests.get(url)

# Check if the request was successful
if response.status_code == 200:
    # Parse the HTML content using Beautiful Soup
    soup = BeautifulSoup(response.content, 'html.parser')

    # Find the table containing population data by its ID
    table = soup.find('table', attrs={'id': 'example2'})

    # Collect the headers from the table
    headers = []

    # Locate the header row within the <thead> HTML tag
    header_row = table.find('thead').find_all('th')

    for th in header_row:
        # Add header text to the headers list
        headers.append(th.text.strip())

    # Initialize an empty list to store our data
    data = []

    # Loop through each row in the table (skipping the header row)
    for tr in table.find_all('tr')[1:]:

        # Create a list of the current row's data
        row = []

        # Find all data cells in the current row
        for td in tr.find_all('td'):
            # Get the text content of the cell and remove extra spaces
            cell_data = td.text.strip()

            # Add the cleaned cell data to the row list
            row.append(cell_data)

        # After getting all cells for this row, add the row to our data list
        data.append(row)

    # Convert the collected data into a pandas DataFrame for easier handling
    df = pd.DataFrame(data, columns=headers)

    # Print the DataFrame to see the collected data
    print(df.shape)
else:
    print(f"Error: {response.status_code} - {response.text}")
在终端运行该 Python 脚本:
python html_table_scraper.py输出应如下所示:
(234,12)此时,你已成功从 HTML 表格中提取了 234 行、12 列。
然后,可以使用 pandas 的 head() 方法及 print() 查看获取到的前十行数据:
print(df.head(10))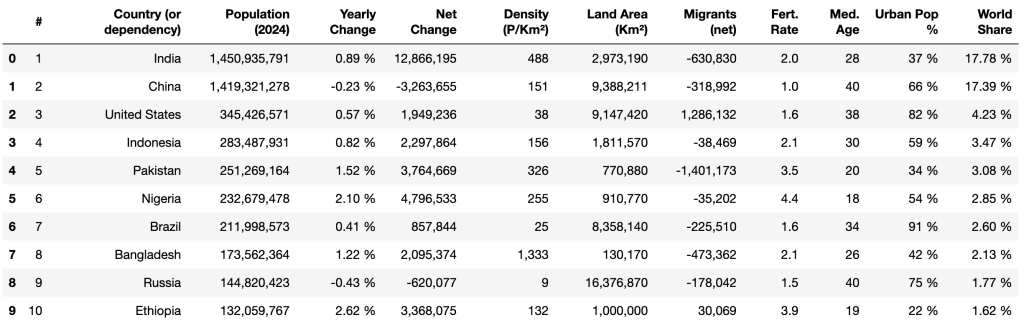
清洗并整理数据
从 HTML 表格中抓取的数据通常需要进行清洗,以保证一致性、准确性,并为后续分析做好准备。由于原始数据可能包含缺失值、格式问题、多余字符或数据类型不正确等问题,这会导致对数据的分析产生误差。通过数据清洗可以将其标准化,并使其与分析目的所需的结构相吻合。
本节将会演示以下数据清洗任务:
- 重命名列名
- 替换缺失值
- 去除逗号并将数据类型转换为正确格式
- 去掉百分号 (%) 并将数据类型转换为正确格式
- 修改数值列的数据类型
重命名列名
pandas 提供了 rename() 方法来对指定的某个列名进行更改,在遇到列名并不直观或需要与分析更配合的场景下非常实用。
可以通过将一个字典传递给 columns 参数来实现对某个列的重命名,其中字典的键为当前列名,值为新列名。本示例中,将下列列名进行修改:
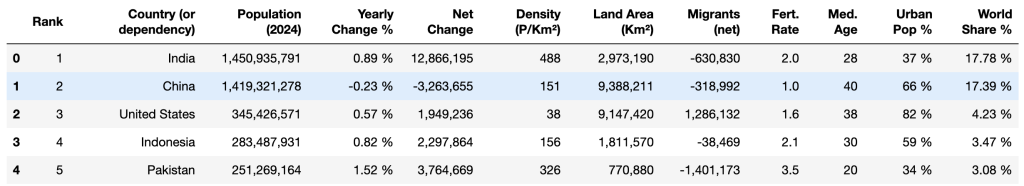
#修改为RankYearly change修改为Yearly change %World Share修改为World Share %
# Rename columns
df.rename(columns={'#': 'Rank'}, inplace=True)
df.rename(columns={'Yearly Change': 'Yearly Change %'}, inplace=True)
df.rename(columns={'World Share': 'World Share %'}, inplace=True)
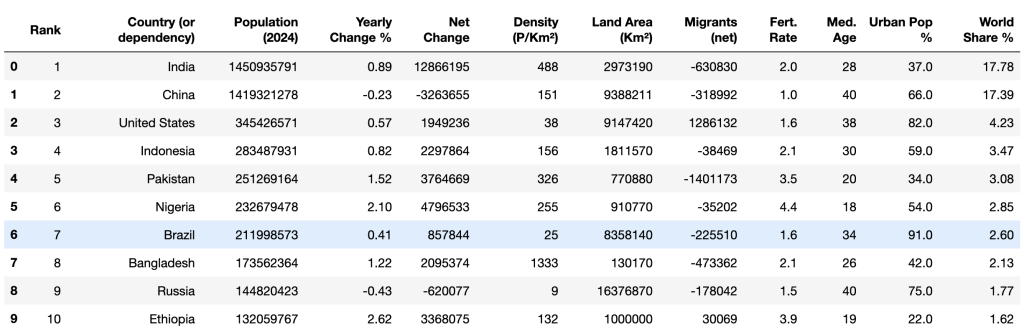
# Show the first 5 rows
print(df.head())现在列名应如下所示:
替换缺失值
数据缺失会影响各种统计分析(如求平均值或求和),导致结果不准确。因此,你需要在做任何计算或者分析之前对数据进行删除、替换或者填充操作。
在抓取到的数据中,Urban Pop % 列可能包含用 N.A. 表示的缺失值。可以使用 pandas 的 replace() 方法将 N.A. 替换为 0%:
# Replace 'N.A.' with '0%' in the 'Urban Pop %' column
df['Urban Pop %'] = df['Urban Pop %'].replace('N.A.', '0%')
去除百分号并转换数据类型
Yearly Change %、Urban Pop % 和 World Share % 这三列含有带有百分号的数值(例如 37.0%),在进行数值运算(如求平均值、最大值、标准差等)时会遇到问题。
可以使用 replace() 去掉百分号,然后使用 astype() 将其转换为 float:
# Remove the '%' sign and convert to float
df['Yearly Change %'] = df['Yearly Change %'].replace('%', '', regex=True).astype(float)
df['Urban Pop %'] = df['Urban Pop %'].replace('%', '', regex=True).astype(float)
df['World Share %'] = df['World Share %'].replace('%', '', regex=True).astype(float)

# Show the first 5 rows
df.head()
上述代码用 replace() 方法结合正则表达式去除了 %,接着使用 astype(float) 转为浮点数。最后用 df.head() 查看 DataFrame 前五行数据。
输出结果应如下:
去除逗号并转换数据类型
现在,Population (2024)、Net Change、Density (P/Km²)、Land Area (Km²) 和 Migrants (net) 这些列包含用逗号分隔的数值(例如 1,949,236),这些都必须去掉逗号才能进行数值运算。
可以使用 replace() 方法去除逗号,然后用 astype() 将其转换为整型:
# Remove commas and convert to integers
columns_to_convert = [
    'Population (2024)', 'Net Change', 'Density (P/Km²)', 'Land Area (Km²)',
    'Migrants (net)'
]

for column in columns_to_convert:
    # Ensure the column is treated as a string first
    df[column] = df[column].astype(str)

    # Remove commas
    df[column] = df[column].str.replace(',', '')

    # Convert to integers
    df[column] = df[column].astype(int)
上面的代码先定义了需要转换的列名列表 columns_to_convert。循环对其中每个列先转成字符串,然后通过 str.replace(',', '') 去掉逗号,最后使用 astype(int) 转为整型。
修改数值列的数据类型
Rank、Med. Age 和 Fert. Rate 这几列虽然包含的是数值,但目前数据类型仍是 object。将它们转换成 int 或 float 以便进行数值运算:
# Convert to integer or float data types and integers

df['Rank'] = df['Rank'].astype(int)
df['Med. Age'] = df['Med. Age'].astype(int)
df['Fert. Rate'] = df['Fert. Rate'].astype(float)
上述代码将 Rank 和 Med. Age 两列转换为整型,而 Fert. Rate 转换为浮点型。
最后使用 head() 方法再次查看前十行数据,确认清洗后的数据类型都符合预期:
print(df.head(10))输出结果应如下所示:
清洗完数据之后,你就可以开始运用各种数学运算(例如 平均值和众数)以及分析方法(例如 相关性)来研究这些数据。
将清洗后的数据导出为 CSV
完成数据清洗后,务必要把结果保存下来以便后续使用或与他人共享。可以将其导出为 CSV 文件,这样就可以在更多工具或软件中对数据进行进一步处理或分析。
pandas 提供 to_csv() 方法,将 DataFrame 中的数据导出为名为 world_population_by_country.csv 的 CSV 文件:
# Save the data to a file
filename = 'world_population_by_country.csv'
df.to_csv(filename, index=False)
总结
通过使用 Beautiful Soup 这个 Python 包,可以轻松解析 HTML 文档并从 HTML 表格中提取数据。在本文中,你学习到了如何抓取、清洗并将数据导出为 CSV 文件。
虽然本教程示例较为简单,但在从更复杂的网站提取数据时,会面临更多挑战和大量的时间投入。比如,抓取分页的 HTML 表格,或处理多层嵌套结构、父子元素的情况,需要对页面结构进行更为细致的理解。此外,网站的结构也可能会随着时间发生变化,从而需要不断维护代码和基础设施。
为了节省时间并让流程更简单,可以考虑使用 Bright Data Web Scraper API。这是一款功能强大的预构建爬虫解决方案,能够帮助你在不需太多技术基础的情况下抓取复杂网站的数据。该 API 可以自动处理数据采集,包括 动态页面、JavaScript 渲染以及 CAPTCHA 验证等问题。
欢迎注册并开始你的免费 Web Scraper API 试用!