Google趋势 是一个免费工具,提供人们在线搜索内容的洞察。通过分析这些搜索趋势,企业可以识别新兴的市场趋势,了解消费者行为,并做出数据驱动的决策,以提升销售和营销效果。从Google趋势中提取数据使公司能够通过定制其策略保持竞争优势。
在本文中,您将学习如何使用Python从Google趋势抓取数据,以及如何有效地存储和分析这些数据。
为何要抓取Google趋势数据
在各种情况下,抓取和分析Google趋势数据都具有重要价值,包括以下几点:
- 关键词研究: 内容创作者和SEO专家需要了解哪些关键词正在获得关注,以便为其网站带来更多有机流量。Google趋势帮助按地区、类别或时间探索热门搜索词,使您能够根据用户兴趣的变化优化内容策略。
- 市场研究: 营销人员必须了解客户的兴趣并预见需求的变化,以做出明智的决策。抓取和分析Google趋势数据使他们能够了解客户的搜索模式并监控趋势的变化。
- 社会研究: 包括本地和全球事件、技术创新、经济变化和政治发展在内的多个因素,都会显著影响公众兴趣和搜索趋势。Google趋势数据提供了对这些变化趋势的宝贵见解,能够进行全面分析和有根据的未来预测。
- 品牌监控: 企业和营销团队必须监控其品牌在市场中的认知度。当您抓取Google趋势数据时,可以将品牌的可见度与竞争对手进行比较,并迅速应对公众认知的变化。
Bright Data抓取Google趋势的替代方案 – Bright Data的SERP API
与其手动抓取Google趋势,不如使用 Bright Data的SERP API 来自动化从搜索引擎实时收集数据。SERP API提供结构化数据,如搜索结果和趋势,具有精确的地理定位且不会被封锁或出现CAPTCHA风险。您只需为成功的请求付费,数据以JSON或HTML格式交付,便于集成。
这一解决方案更快、更具可扩展性,并且无需复杂的抓取脚本。开始您的免费试用,并通过Bright Data的 Google趋势抓取器 简化您的数据收集。
如何从Google趋势抓取数据
Google趋势没有提供官方的API来抓取趋势数据,但您可以使用几个第三方API和库来访问这些信息,例如 pytrends,这是一个Python库,提供用户友好的API,让您可以自动下载Google趋势的报告。然而,虽然pytrends易于使用,但它提供的数据有限,因为它无法访问动态渲染或在交互元素后面的数据。为了解决这个问题,您可以结合使用 Selenium 和 Beautiful Soup 来抓取Google趋势并从动态渲染的网页中提取数据。Selenium是一个用于与网站交互和抓取的开源工具,使用JavaScript动态加载内容。Beautiful Soup帮助解析抓取的HTML内容,使您能够从网页中提取特定数据。
在开始本教程之前,您需要在您的机器上安装并设置好 Python 。您还需要为将在接下来的几个部分中构建的Python脚本创建一个空的项目目录。
创建虚拟环境
虚拟环境允许您将Python包隔离到不同的目录中,以避免版本冲突。要创建一个新的虚拟环境,请在终端中执行以下命令:
# navigate to the root of your project directory before executing the command
python -m venv myenv
此命令将在项目目录中创建一个名为 myenv 的文件夹。通过执行以下命令激活虚拟环境:
source myenv/bin/activate任何后续的Python或pip命令也将在此环境中执行。
安装依赖项
如前所述,您需要Selenium和Beautiful Soup来抓取和解析网页。此外,为了分析和可视化抓取的数据,您需要安装 pandas 和 Matplotlib Python模块。使用以下命令安装这些包:
pip install beautifulsoup4 pandas matplotlib selenium查询Google趋势搜索数据
Google趋势仪表板 允许您按地区、日期范围和类别探索搜索趋势。例如,此URL显示了美国过去七天咖啡的搜索趋势:
https://trends.google.com/trends/explore?date=now%207-d&geo=US&q=coffee当您在浏览器中打开此网页时,您会注意到数据是使用JavaScript动态加载的。要抓取动态内容,您可以使用 Selenium WebDriver,它模拟用户交互,如点击、输入或滚动。
您可以在Python脚本中使用 webdriver 在浏览器窗口中加载网页,并在内容加载后提取其页面源代码。为了处理动态内容,您可以添加一个显式的 time.sleep 以确保在获取页面源代码之前所有内容都已加载。如果您想了解更多处理动态内容的技术,请查看 本指南。
在项目根目录中创建一个 main.py 文件,并添加以下代码片段:
from selenium import webdriver
from selenium.webdriver.chrome.options import Options

import time

def get_driver():
    # update the path to the location of your Chrome binary
    CHROME_PATH = "/Applications/Google Chrome.app/Contents/MacOS/Google Chrome"

    options = Options()
    # options.add_argument("--headless=new")
    options.binary_location = CHROME_PATH

    driver = webdriver.Chrome(options=options)

    return driver


def get_raw_trends_data(
    driver: webdriver.Chrome, date_range: str, geo: str, query: str
) -> str:
    url = f"https://trends.google.com/trends/explore?date={date_range}&geo={geo}&q={query}"

    print(f"Getting data from {url}")

    driver.get(url)
    # workaround to get the page source after initial 429 error
    driver.get(url)
    driver.maximize_window()

    # Wait for the page to load
    time.sleep(5)

    return driver.page_source
get_raw_trends_data 方法接受日期范围、地理区域和查询名称作为参数,并使用Chrome WebDriver获取页面内容。请注意, driver.get 方法被调用了两次,以解决Google在首次加载URL时抛出的初始 429错误 的解决方法。
您将在接下来的部分中使用此方法来获取数据。
使用Beautiful Soup解析数据
趋势 页面的一个搜索词包括一个 按子区域的兴趣 小部件,其中包含分页记录,值在0到100之间,表示基于位置的搜索词的受欢迎程度。使用以下代码片段使用Beautiful Soup解析这些数据:
# Add import
from bs4 import BeautifulSoup

def extract_interest_by_sub_region(content: str) -> dict:
    soup = BeautifulSoup(content, "html.parser")

    interest_by_subregion = soup.find("div", class_="geo-widget-wrapper geo-resolution-subregion")

    related_queries = interest_by_subregion.find_all("div", class_="fe-atoms-generic-content-container")

    # Dictionary to store the extracted data
    interest_data = {}

    # Extract the region name and interest percentage
    for query in related_queries:
        items = query.find_all("div", class_="item")
        for item in items:
            region = item.find("div", class_="label-text").text.strip()
            interest = item.find("div", class_="progress-value").text.strip()
            interest_data[region] = interest

    return interest_data
此代码片段使用其类名找到匹配的 div 以获取子区域数据,并迭代结果以构建一个 interest_data 字典。
请注意,类名可能会在将来更改,您可能需要使用 Chrome DevTools 检查 元素功能 来找到正确的名称。
现在您已经定义了辅助方法,使用以下代码片段查询“coffee”的数据:
# Parameters
date_range = "now 7-d"
geo = "US"
query = "coffee"

# Get the raw data
driver = get_driver()

raw_data = get_raw_trends_data(driver, "now 7-d", "US", "coffee")

# Extract the interest by region
interest_data = extract_interest_by_sub_region(raw_data)

# Print the extracted data
for region, interest in interest_data.items():
    print(f"{region}: {interest}")
您的输出如下:
夏威夷: 100
蒙大拿: 96
俄勒冈: 90
华盛顿: 86
加利福尼亚: 84
管理数据分页
由于小部件中的数据是分页的,上一节中的代码片段仅返回小部件第一页的数据。要获取更多数据,您可以使用Selenium WebDriver查找并点击 下一页 按钮。此外,您的脚本必须通过点击 接受 按钮来处理cookie同意横幅,以确保横幅不会遮挡页面上的其他元素。
要处理cookie和分页,请在 main.py 的末尾添加以下代码片段:
# Add import
from selenium.webdriver.common.by import By


all_data = {}

# Accept the cookies
driver.find_element(By.CLASS_NAME, "cookieBarConsentButton").click()

# Get paginated interest data
while True:
    # Click the md-button to load more data if available
    try:
        geo_widget = driver.find_element(
            By.CSS_SELECTOR, "div.geo-widget-wrapper.geo-resolution-subregion"
        )

        # Find the load more button with class name "md-button" and aria-label "Next"
        load_more_button = geo_widget.find_element(
            By.CSS_SELECTOR, "button.md-button[aria-label='Next']"
        )

        icon = load_more_button.find_element(By.CSS_SELECTOR, ".material-icons")

        # Check if the button is disabled by checking class-name includes arrow-right-disabled
        if "arrow-right-disabled" in icon.get_attribute("class"):
            print("No more data to load")
            break

        load_more_button.click()
        time.sleep(2)

        extracted_data = extract_interest_by_sub_region(driver.page_source)
        all_data.update(extracted_data)
    except Exception as e:
        print("No more data to load", e)
        break

driver.quit()
此代码片段使用现有的 driver 实例,通过匹配其类名来查找并点击 下一页 按钮。它通过检查元素中是否包含 arrow-right-disabled 类来判断按钮是否被禁用,表明您已到达小部件的最后一页。当满足此条件时,它将退出循环。
可视化数据
为了轻松访问和进一步分析您抓取的数据,您可以使用 csv.DictWriter 将提取的子区域数据保存到CSV文件中。
首先,在 main.py 中定义 save_interest_by_sub_region 以将 all_data 字典保存到CSV文件中:
# Add import
import csv


def save_interest_by_sub_region(interest_data: dict):
    interest_data = [{"Region": region, "Interest": interest} for region, interest in interest_data.items()]

    csv_file = "interest_by_region.csv"

    # Open the CSV file for writing
    with open(csv_file, mode='w', newline='') as file:
        writer = csv.DictWriter(file, fieldnames=["Region", "Interest"])
        writer.writeheader()  # Write the header
        writer.writerows(interest_data)  # Write the data

    print(f"Data saved to {csv_file}")
    return csv_file
然后,您可以使用 pandas 将CSV文件作为 DataFrame 打开,并执行分析,例如按特定条件筛选数据、使用 group-by 操作聚合数据或使用图表可视化趋势。
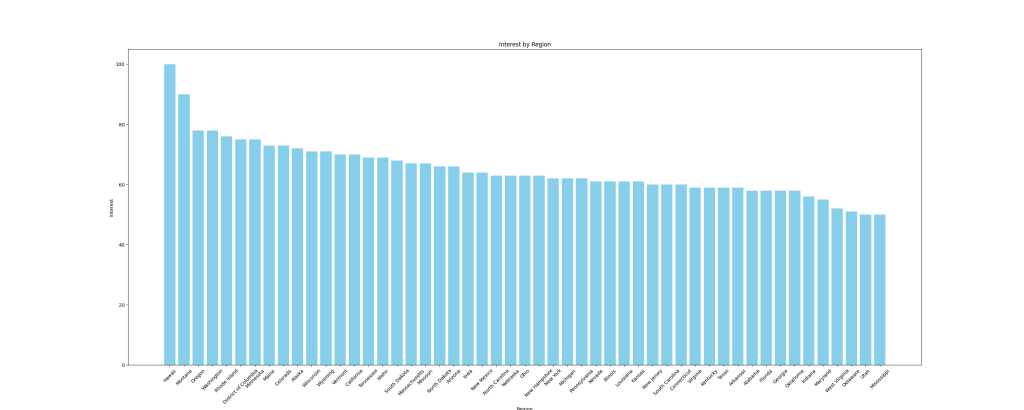
例如,让我们将数据可视化为 柱状图 以比较子区域的兴趣。要创建图表,请使用与DataFrame无缝协作的 matplotlib Python库。在 main.py 文件中添加以下函数以创建柱状图并将其保存为图像:
# Add imports
import pandas as pd
import matplotlib.pyplot as plt


def plot_sub_region_data(csv_file_path, output_file_path):
    # Load the data from the CSV file
    df = pd.read_csv(csv_file_path)

    # Create a bar chart for comparison by region
    plt.figure(figsize=(30, 12))

    plt.bar(df["Region"], df["Interest"], color="skyblue")

    # Add titles and labels
    plt.title('Interest by Region')
    plt.xlabel('Region')
    plt.ylabel('Interest')

    # Rotate the x-axis labels if needed
    plt.xticks(rotation=45)

    # Show the plot
    plt.savefig(output_file_path)
在 main.py 文件末尾添加以下代码片段以调用之前的函数:
csv_file_path = save_interest_by_sub_region(all_data)

output_file_path = "interest_by_region.png"
plot_sub_region_data(csv_file_path, output_file_path)
此代码片段创建的图表如下所示:
本教程的所有代码均可在 这个GitHub仓库 中找到。
抓取挑战
在本教程中,您从Google趋势抓取了一小部分数据,但随着您的抓取脚本规模和复杂性的增加,您可能会遇到诸如 IP封禁 和CAPTCHA等挑战。
例如,当您使用此脚本向网站发送更频繁的流量时,您可能会面临IP封禁,因为许多网站都有检测和阻止机器人流量的防护措施。为避免这种情况,您可以使用手动IP轮换或 最佳代理服务之一。如果您不确定应该使用哪种类型的代理,请阅读我们的文章,涵盖了 适用于网络抓取的最佳代理类型。
遇到CAPTCHA或reCAPTCHA是网站在检测到或怀疑有机器人流量或异常时使用的另一常见挑战。为避免这种情况,您可以减少请求频率,使用适当的请求头,或使用能够解决这些挑战的第三方服务。
结论
在本文中,您学习了如何使用Python结合Selenium和Beautiful Soup抓取Google趋势数据。
随着您在网络抓取之旅的继续,您可能会遇到诸如IP封禁和CAPTCHA等挑战。与其管理复杂的抓取脚本,不如考虑使用Bright Data的SERP API,该API自动化了收集准确的实时搜索引擎数据(包括Google趋势)的过程。SERP API处理动态内容、基于位置的定位,并确保高成功率,为您节省时间和精力。
立即注册并开始您的SERP API免费试用吧!